
At my church volunteers tell a story each week to children as part of the worship service. I wrote a short book about how to improve these experiences because I recognized these story events occasionally have some “missed opportunities.” Sometimes storytellers are not experienced, sometimes a story is either too long or lacking in plot, and from time to time children lose focus.
Story Secrets from Scripture is about how to develop and deliver children’s stories for worship, vacation Bible school, and Bible study. The book covers how to find personal stories, assign teaching points, and tell these stories live.

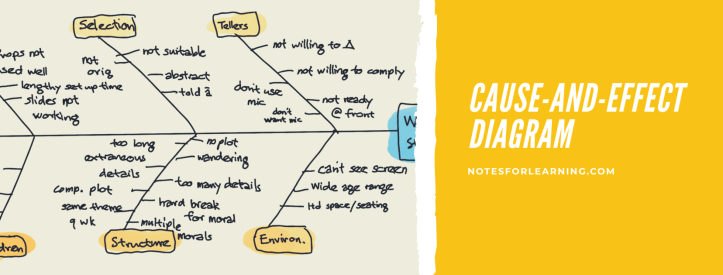
To discuss the three inter-related elements of story, storyteller, and audience (children), I first thought about the reasons that things go wrong sometimes when a story is told. Before I started outlining the first chapter, “Setting the Stage.” I created a cause-and-effect diagram. Using categories related to children’s story time, I added reasons as they came to mind.

Fishbone Diagram
Also known as the Ishikawa Diagram and Fishbone Diagram, the cause-and-effect diagram was developed an engineering professor at Tokyo University, Kauru Ishikawa. Ishikawa first applied the cause-and-effect diagram to manufacturing in 1943. Since then it has spread in popularity and is considered one of the most important tools to evaluate and improve quality.
The descriptions below of the cause-and-effect diagram are taken from Ishikawa’s book, Guide to Quality Control. The edition pictured below is from 1976. I purchased this copy for 30 cents from Amazon. The newer, 1990 edition is also available from used bookstores at reasonable prices.

Cause-and-Effect Diagrams
In order to illustrate on a diagram the relationship between the cause and the effect, we need to know the causes and effects in concrete forms. Therefore, the effect = quality characteristics, and cause = factors, [resulting in a cause-and-effect diagram]. In general practice, the factors must be written in more detail to make the chart useful. 
Step 1 – Decide on the quality characteristic. This is something we want to improve and control.
Step 2 – Write the quality characteristic on the right side. Draw a broad arrow from the left side to the right side.

Step 3 – Write the main factors which may be causing the problem, directing a branching line to the main line. It is recommended to group the major possible causal factors into items such as materials, machines or tools, workers, inspection, etc. Each individual group will form a branch.

Step 4 – Now onto each of these branch items, write in the detailed factors which may be regarded as the causes. These will be like twigs. Onto each of these, write in even more detailed factors, making smaller twigs.

A cause-and-effect diagram can be used for any problem. Since this kind of diagram illustrates the relationship between the cause and the effect in a rational manner, it can be used in any situation. Our aim is to get results; since measures are to be taken against the cause, if we do not know the relationship between cause and effect of a problem, then we cannot take any action to resolve it. A cause-and-effect diagram shows us most clearly the causes so we can take action quickly.
A Good Brainstorming Tool
The cause-and-effect diagram is an effective brainstorming tool for use with teams and individually. Whenever multiple causes exist that can impact an effect or outcome, this tool is my first choice. The mind map style of brainstorming is an alternate view of the cause-and-effect diagram. For mind mapping, the main topics branch out from a central word, but the concept of starting with broad categories of factors and zooming into more detail is similar.
